ggchangepoint
Combines Changepoint Analysis with 'ggplot2'
A unified, tidy, 'ggplot2'-native interface to changepoint detection in R. A 'cpt_detect()' dispatcher covers 51 methods (penalised and optimal partitioning, multiscale and search methods, nonparametric and kernel methods, Bayesian methods, high-dimensional, functional, covariance and network methods, regression breaks through a formula interface, seasonal-trend decomposition, the classical single-change tests, and anomalous stretches that return to a baseline), with distribution families for counts, binary outcomes and waiting times, missing-value handling, grouped data, and constraints on locations and segment lengths. Every result is the same 'ggcpt' object, in one verified location convention, with 'broom'-style tidy/glance/augment methods, 'autoplot()' and composable 'ggproto' layers. Around detection: which coordinates of a multivariate series changed, certified with family-wise error control; distribution-free confidence sets for each location; effect sizes and what the series would have done without each change; a test for a change at a date fixed in advance, tests for a change anywhere, and screening of many series with false discovery rate control; a check of whether a change was abrupt or gradual; weights over the number of changes; assumption checks and goodness of fit, robustness to the noise model, stability, consensus and influence diagnostics, supervised detection, sequential monitoring including cumulative-sum and exponentially weighted moving-average control charts, power and study design, benchmarks, reports and an export under a documented 'JSON' schema. What each engine does (its runtime, whether its answer survives a change of units or a reversal of time, its false positives by noise regime and data type, its false alarms on pure noise) and the calibration of the package's own intervals, tests and monitors are measured and shipped as data, and 'cpt_recommend()' chooses from those measurements. 'cpt_register_method()' brings external and non-CRAN detectors into the same grammar.
ggchangepoint 

Find where a time series changed with any of 51 methods, and get the same tidy, plottable answer from every one.
🔍 One series, one call, one picture
library(ggchangepoint)
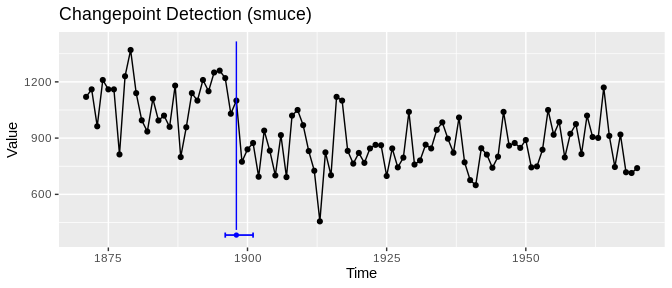
fit <- cpt_detect(Nile, method = "smuce")
fit$changepoints
#> # A tibble: 1 × 5
#>      cp cp_index cp_value ci_lower ci_upper
#>   <int>    <dbl>    <dbl>    <int>    <int>
#> 1    28     1898     1100       26       31
autoplot(fit, show_ci = TRUE)
Five detectors built on different ideas agree:
ggcpt_compare_table(Nile, methods = c("smuce", "not", "wbs", "mosum",
                                      "strucchange"))
#> # A tibble: 5 × 3
#>   method         cp cp_value
#>   <chr>       <int>    <dbl>
#> 1 smuce          28     1100
#> 2 not            28     1100
#> 3 wbs            28     1100
#> 4 mosum          28     1100
#> 5 strucchange    28     1100
🧰 Then ask the next question
| You want to know | Call |
|---|---|
| How big was the change? | cpt_effect(fit) |
| Where exactly, with no model assumed? | cpt_confint(fit, method = "conformal") |
| What would have happened without it? | cpt_counterfactual(fit) |
| Which of my sensors changed? | cpt_attribute(fit) |
| Did anything change in a year I already had in mind? | cpt_test_at(Nile, when = 1899) |
| Should I believe this count? | cpt_assumptions(fit) |
| Which method suits my data? | cpt_recommend(noise = "autocorrelated") |
| A stretch that returns to normal? | cpt_detect(x, method = "capa") |
| Watching a live stream? | cpt_monitor("cusum", baseline = b) |
| What can each of the 51 methods do? | cpt_methods() |
🚀 Setup
install.packages("ggchangepoint")ggchangepoint::cpt_install_engines(c("core", "regression"))adds the engines this page uses ("all"for every one; three ship with the package).cpt_detect(your_series), thenautoplot()the result.
💡 Good to know
| For | Do |
|---|---|
| Data far from unit scale | Use change_in = "meanvar", or standardise first: pelt, binseg and fpop assume unit noise |
| Autocorrelated series | Check with cpt_assumptions(fit); cpt_robustness(fit) re-runs under another noise model |
| A date fixed in advance | cpt_test_at() gives an exact test at that date |
| Gaps in the series | na_action = "omit" keeps the original positions |
📚 Learn more
Reference · Choosing a method · Beyond the location · Best practice · Introduction