healthyR.ai
The Machine Learning and AI Modeling Companion to 'healthyR'
Hospital machine learning and ai data analysis workflow tools, modeling, and automations. This library provides many useful tools to review common administrative hospital data. Some of these include predicting length of stay, and readmits. The aim is to provide a simple and consistent verb framework that takes the guesswork out of everything.
healthyR.ai 


The Machine Learning and AI Modeling Companion to healthyR
To view the full wiki, click here: Full healthyR.ai Wiki
healthyR.ai is a comprehensive R package designed to streamline
machine learning and AI workflows for healthcare data analysis. It
provides an intuitive, consistent verb-based framework that simplifies
data exploration, transformation, and modeling—taking the guesswork out
of healthcare analytics.
✨ Key Features
🤖 AutoML Functions
Automated machine learning with hyperparameter tuning for multiple algorithms: - Tree-based models: C5.0, Cubist, Random Forest (Ranger), XGBoost - Support Vector Machines: Polynomial and RBF kernels - Linear models: GLMnet (elastic net regression) - Instance-based: K-Nearest Neighbors (KNN) - MARS: Multivariate Adaptive Regression Splines (Earth)
📊 Clustering & Dimensionality Reduction
- K-Means AutoML: Automatic optimal cluster detection with scree plots and elbow methods
- UMAP: Uniform Manifold Approximation and Projection for visualization
- PCA: Principal Component Analysis with loadings plots
🔧 Data Preprocessing & Transformation
- Scaling functions: Zero-one normalization, z-score standardization
- Statistical transformations: Fourier, hyperbolic, polynomial transformations
- Robust methods: Winsorization (truncate and move)
- Custom recipe steps: Seamless integration with
tidymodels
📈 Visualization & Analysis
- Control charts: Statistical process control for healthcare metrics
- Distribution analysis: Density plots, histograms, Q-Q plots
- Statistical measures: Skewness, kurtosis, range statistics
- Color-blind friendly palettes: Accessible visualizations
📦 Installation
Install the released version from CRAN:
install.packages("healthyR.ai")
Or get the development version from GitHub:
# install.packages("devtools")
devtools::install_github("spsanderson/healthyR.ai")
🚀 Quick Start
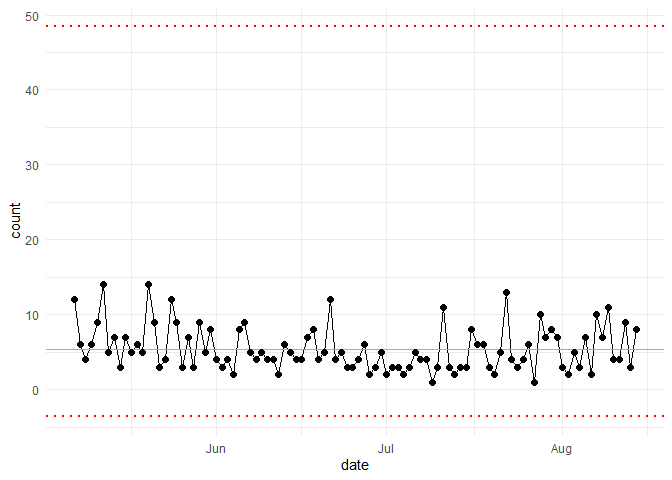
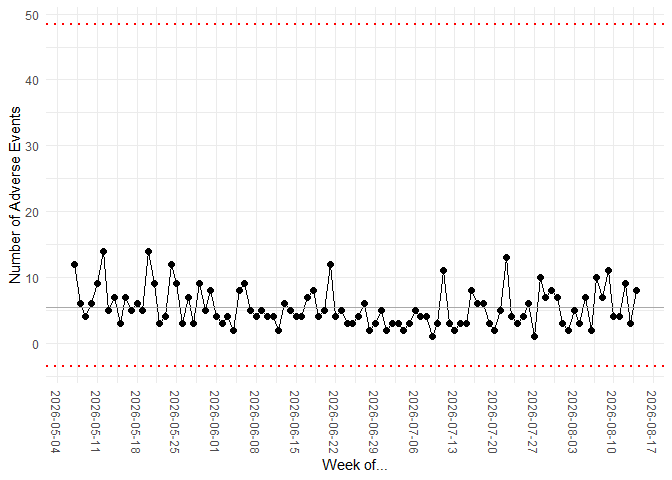
Control Charts for Healthcare Monitoring
library(healthyR.ai)
library(ggplot2)

# Create sample adverse events data
data_tbl <- tibble::tibble(
  day = sample(c("Monday", "Tuesday", "Wednesday", "Thursday", "Friday"), 100, TRUE),
  person = sample(c("Tom", "Jane", "Alex"), 100, TRUE),
  count = rbinom(100, 20, ifelse(day == "Friday", .5, .2)),
  date = Sys.Date() - sample.int(100)
)

# Generate control chart
my_chart <- hai_control_chart(data_tbl, count, date)
my_chart +
  ylab("Number of Adverse Events") +
  scale_x_date(name = "Week of...", date_breaks = "week") +
  theme(axis.text.x = element_text(angle = -90, vjust = 0.5, hjust = 1))
AutoML with K-Nearest Neighbors
library(healthyR.ai)
library(recipes)
library(dplyr)

# Prepare your data
data_split <- rsample::initial_split(mtcars, prop = 0.8)
train_data <- rsample::training(data_split)
test_data <- rsample::testing(data_split)

# Create a recipe
rec_obj <- recipes::recipe(mpg ~ ., data = train_data)

# Run AutoML KNN
knn_results <- hai_auto_knn(
  .data = train_data,
  .rec_obj = rec_obj,
  .best_metric = "rmse",
  .model_type = "regression"
)

# Access the best model
best_model <- knn_results$model_info |>
  dplyr::filter(model_spec == knn_results$best_model_spec) |>
  dplyr::pull(model)
K-Means Clustering with AutoML
library(healthyR.ai)
library(dplyr)

# Prepare data
data_tbl <- healthyR.data::healthyR_data |>
  dplyr::select(length_of_stay, age) |>
  dplyr::filter(length_of_stay < 20)

# Auto K-Means - finds optimal clusters
kmeans_obj <- hai_kmeans_automl(
  .data = data_tbl,
  .max_clusters = 15
)

# Visualize the scree plot
hai_kmeans_scree_plot(kmeans_obj)

# Get user-item tibble for analysis
hai_kmeans_user_item_tbl(kmeans_obj)
Data Preprocessing with Custom Steps
library(healthyR.ai)
library(recipes)

# Create a recipe with custom preprocessing steps
rec <- recipe(mpg ~ ., data = mtcars) |>
  step_hai_scale_zscore(all_numeric_predictors()) |>
  step_hai_fourier(disp, period = 365, order = 1) |>
  step_hai_hyperbolic(hp, wt)

# Prep and bake
prepped_rec <- prep(rec)
transformed_data <- bake(prepped_rec, new_data = NULL)
📚 Documentation
- Website: https://www.spsanderson.com/healthyR.ai/
- Function Reference: Browse all available functions and their documentation
- Vignettes: In-depth tutorials and use cases
🎯 Use Cases
healthyR.ai is designed for healthcare data analysts and data
scientists who need to:
- Predict length of stay for hospital patients
- Forecast readmission rates with multiple algorithms
- Monitor quality metrics using control charts
- Identify patient cohorts through clustering
- Preprocess and transform healthcare data for modeling
- Automate hyperparameter tuning across multiple model types
- Visualize distributions and identify outliers
🤝 Contributing
We welcome contributions! If you’d like to contribute to healthyR.ai:
- Fork the repository
- Create a feature branch (
git checkout -b feature/amazing-feature) - Commit your changes (
git commit -m 'Add amazing feature') - Push to the branch (
git push origin feature/amazing-feature) - Open a Pull Request
🐛 Issues & Feature Requests
Found a bug or have a feature request? Please file an issue at: https://github.com/spsanderson/healthyR.ai/issues
If you find this package useful, please leave a star on GitHub! ⭐
📖 Citation
If you use healthyR.ai in your research, please cite it:
citation("healthyR.ai")
👨💻 Author
Steven P. Sanderson II, MPH - Website: https://www.spsanderson.com/ - GitHub: @spsanderson - ORCID: 0009-0006-7661-8247
📄 License
MIT © Steven P. Sanderson II, MPH
🙏 Acknowledgments
healthyR.ai builds upon the excellent work of the
tidymodels ecosystem and integrates
seamlessly with: - recipes for data preprocessing - parsnip for
unified model interfaces - tune for hyperparameter optimization -
workflows for streamlined modeling pipelines - yardstick for model
evaluation
Special thanks to all contributors and the R community for their support!